

Looking For More Great Content?
Get even more informative Toronto real estate news sent directly to your inbox by signing up for my newsletter here. All it takes is a few easy clicks.

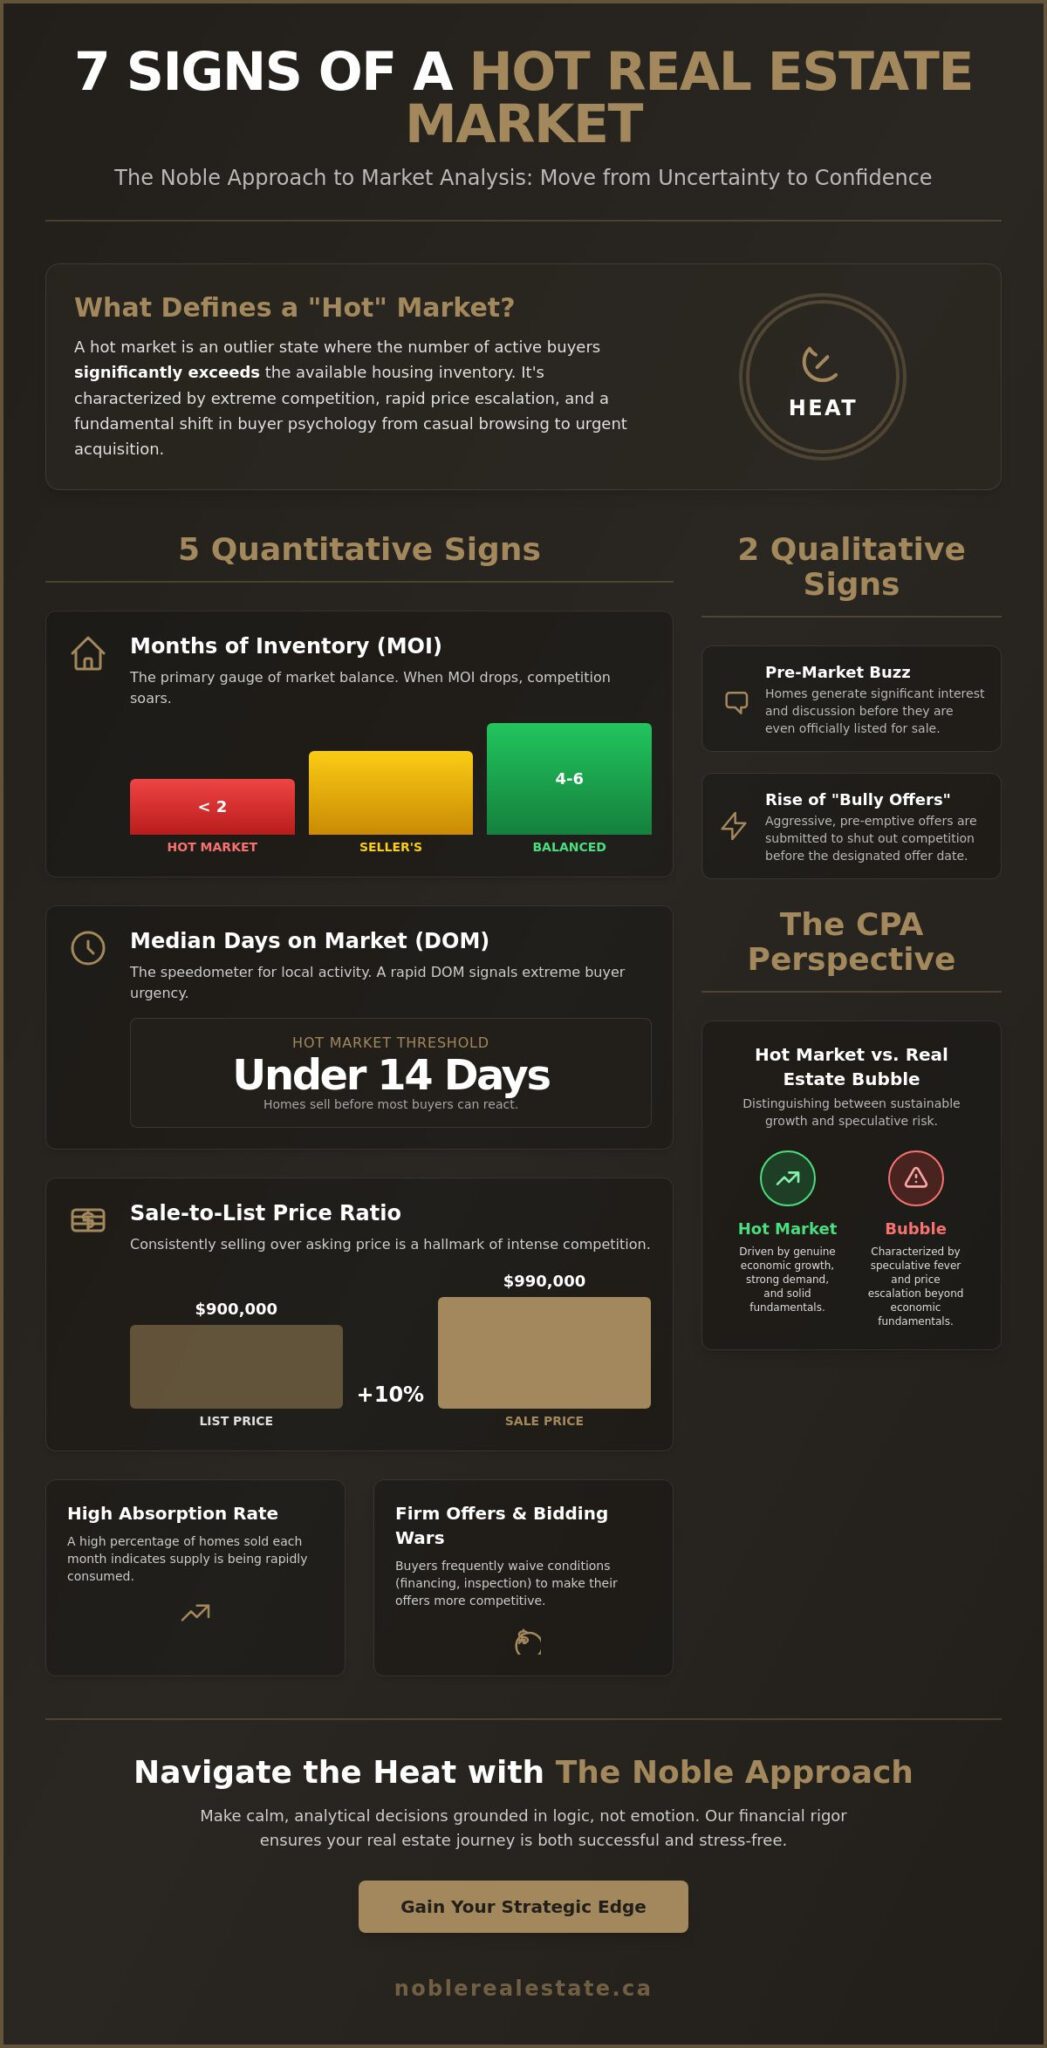
7 Key Signs of a Hot Real Estate Market: A Data-Driven Guide for 2026
04/26/26 Uncategorized

Did you know that the Canadian Real Estate Association (CREA) projects national average home prices will rise by 4.9% throughout 2025? While that sounds like a steady climb, local pockets often move much faster. You’ve likely felt the frustration of watching a “For Sale” sign go up on Monday only to see a “Sold” sticker by Wednesday. It’s natural to worry about missing the peak or feel overwhelmed by conflicting economic headlines. Recognizing the specific signs of a hot real estate market is the only way to move from a place of uncertainty to one of total confidence.
We believe that complex financial decisions should be stress-free and straightforward. This is the core of The Noble Approach. We apply analytical rigor to ensure your real estate goals are achievable and handled with care. This guide will show you exactly how to identify a sellers’ market before the competition does. You’ll gain a clear checklist to evaluate your local neighbourhood and the strategic edge needed to list your home at the perfect price point. We’re diving into seven key data points, including inventory months and list-to-sale price ratios, to ensure your next real estate journey is both successful and enjoyable.
Key Takeaways
- Distinguish between a standard seller’s market and a high-heat outlier by analyzing critical data indicators like Days on Market (DOM) and sale-to-list price ratios.
- Learn to identify the qualitative signs of a hot real estate market appearing on the streets of Durham Region, from pre-market buzz to the rise of bully offers.
- Apply a CPA’s analytical rigour to assess market sustainability, helping you differentiate between genuine economic growth and speculative bubble risks.
- Master “The Noble Approach” to navigating bidding wars and pricing strategies, ensuring you maximize your return without over-leveraging your financial future.
Understanding the “Hot” Market: The Noble Definition
A hot market occurs when the number of active buyers significantly exceeds the available housing inventory. While many people use the terms “seller’s market” and “hot market” interchangeably, they represent different intensities. A seller’s market is a technical state where inventory levels favor the homeowner. A hot market is an outlier, characterized by extreme competition and rapid price escalation. When this heat accelerates beyond economic fundamentals, it can sometimes signal a real estate bubble, making it vital to distinguish between sustainable growth and speculative fever.
Market temperature is rarely uniform across Canada. It’s common to see the Toronto core experience a cooling period while suburban pockets like Uxbridge remain scorching. Identifying these signs of a hot real estate market requires “The Noble Approach.” This methodology leverages a background in finance to look past the hype, focusing instead on the underlying data that predicts shifts before they become public knowledge. It’s about providing a calm, analytical perspective when the market feels chaotic and ensuring your decisions are grounded in logic rather than emotion.
The Economics of Supply and Demand in Real Estate
We measure market heat primarily through Months of Inventory (MOI). In a balanced Canadian market, we typically see four to six months of supply. When MOI drops below two months, the psychological landscape shifts from casual browsing to urgent acquisition. Buyers stop comparing minor features and start competing on terms to secure a property. Absorption Rate is the percentage of available homes sold in a specific month; it acts as a primary indicator of how quickly prices will rise in the immediate future.
Why “Hot” Doesn’t Always Mean “Expensive”
Velocity is often a better indicator of market heat than the actual price point. A C$2.5 million luxury estate in a quiet pocket might sit for 60 days, while a C$900,000 detached home in the Durham Region sells in four days with twelve offers. The latter is the “hotter” market despite the lower price. Local lifestyle drivers play a massive role here. For example, proximity to prestigious amenities like Wooden Sticks Golf Club can create micro-markets where demand remains insulated from broader economic downturns. These localized “heat zones” are where savvy investors and families find the most resilient value.
- High Velocity: Properties sell faster than the 10-year historical average.
- Low MOI: Inventory levels stay consistently below three months.
- Localized Demand: Specific neighborhoods outperform the provincial average due to unique amenities.
5 Quantitative Signs of a Hot Real Estate Market
Data offers the objective clarity you need to make sound financial decisions. Identifying the signs of a hot real estate market requires looking past the noise and into the raw numbers that define a seller’s advantage. By analyzing specific metrics, we can determine if a market is merely active or if it has entered an unsustainable phase of growth.
Decoding Days on Market (DOM)
Median Days on Market (DOM) serves as the primary speedometer for local activity. This figure represents the time between a listing going live and an offer being accepted. When the median DOM drops below the 14-day threshold, it signals extreme buyer urgency and a severe lack of available options. To time your listing for maximum impact, watch for a consistent downward trend over a 90-day period. This analytical approach helps us apply the Noble Approach, ensuring you don’t just sell, but sell with the best possible terms while inventory is at its tightest. Homes selling in under two weeks often suggest that buyers are waiving conditions to secure a property before competitors can react.
Sale Price vs. List Price Dynamics
In a heated market, the Sale-to-List Price Ratio frequently climbs above 100%. A consistent 5% to 10% spread over the asking price is a hallmark of high demand and strategic bidding wars. Many sellers use a specific strategy of under-pricing to fuel these competitions and drive the final price higher. List price is often a marketing tool designed to generate momentum, not a definitive indicator of a property’s market value. These figures align with the Top 10 Housing Market Indicators used by professionals to track momentum. If you see C$1,000,000 listings consistently closing at C$1,100,000, the market has moved beyond standard appreciation into a high-velocity phase.
Inventory Levels and Absorption
Inventory levels remain the most reliable predictor of price appreciation. A balanced market typically holds about six months of supply. When inventory levels dip below 4 months, the market shifts firmly into a seller’s favor. You can calculate your local Uxbridge absorption rate by dividing the total number of active listings by the number of homes sold in the previous 30 days.
- The Inventory Deficit: Track the gap between new listings and sold units. If “Solds” outpace “New” for three consecutive months, prices will inevitably rise.
- Price Appreciation Velocity: Watch for month-over-month growth exceeding 2%. Such rapid climbs are often unsustainable over the long term.
- Shadow Inventory: Be aware of homes withheld by owners waiting for peak prices, which can cause a sudden surge in supply later.
Understanding these metrics allows for a stress-free and straightforward transition. If you are curious about how these numbers affect your specific property, you can view my current listings to see real-time market performance in your neighbourhood.
Qualitative Indicators: What You’ll See on the Streets
While spreadsheets tell one story, the streets of the Durham Region tell another. In a fast-moving market, the first visual cue is the proliferation of “Coming Soon” signs. These aren’t just marketing tools; they’re strategic bait designed to build a backlog of eager buyers before a property even hits the MLS. By the time the “For Sale” sign actually goes up, there’s often a queue of cars already lined up for showings. This pre-market buzz is one of the most reliable signs of a hot real estate market.
Open house attendance serves as a real-time thermometer for local demand. In 2024, a typical weekend in Uxbridge might see five to ten groups through a home. In a peak 2026 scenario, those numbers often swell to thirty or forty groups over a single Saturday. To understand how these local trends compare to broader North American shifts, analysts often look at the comprehensive picture of housing in America to track vacancy rates and construction permits that influence cross-border migration patterns. When you see neighbors standing on the sidewalk discussing the volume of visitors at a nearby listing, you’re witnessing the market’s heat firsthand.
The “Bully Offer” Phenomenon
A bully offer, or pre-emptive offer, occurs when a buyer submits a bid before the seller’s scheduled offer date. It’s an aggressive tactic meant to “bully” other competitors out of the way. In Uxbridge, accepting an early offer can be tempting, but it carries the risk of leaving money on the table if a wider bidding war would have driven the price higher. The Noble Approach manages these high-pressure scenarios by analyzing the financial strength of the offer against projected market interest. This ensures sellers don’t just act fast, but act wisely.
Waiving Conditions: A High-Risk Signal
In the most competitive cycles, the standard five-day window for financing and home inspections often disappears. Buyers start submitting “firm” offers to stand out. This is a significant red flag for financial stability. Waiving an inspection on a C$1,200,000 property can lead to unforeseen repair costs exceeding C$50,000. From a CPA-led perspective, this strategy is high-risk. I always advise clients to conduct a “pre-inspection” before offer night or ensure their mortgage pre-approval is rock-solid. Protecting your capital is vital when the market feels “too hot” to handle rationally. Using data-backed signs of a hot real estate market helps you stay grounded when emotions run high.
The CPA Perspective: Hot Market vs. Real Estate Bubble
Identifying the true signs of a hot real estate market requires more than just counting “Sold” signs in a neighborhood. It demands a rigorous financial analysis that separates sustainable growth from speculative fever. My background as a CPA allows me to look past the “FOMO” that often clouds judgment during peak cycles. A healthy hot market is driven by tangible economic pillars like job creation and population growth. A bubble, by contrast, relies on the dangerous assumption that prices will rise indefinitely regardless of local income levels.
The core difference lies in the “why” behind the numbers. In 2026, we’re seeing a market fueled by a stabilized interest rate environment. With the Bank of Canada’s overnight rate projected to hold between 3.0% and 3.5%, buyers have regained the confidence to move forward. However, when price appreciation outpaces local wage growth by more than 10% annually, the heat starts to look like a bubble. We monitor these ratios closely to ensure our clients are building equity, not just chasing a trend.
Economic Fundamentals in the Durham Region
Uxbridge and the broader Durham Region offer a unique case study in market resilience. While urban Toronto condos faced volatility in 2024 and 2025, the demand for houses for sale in Uxbridge has remained consistent. This isn’t accidental. The “Work from Home” legacy has permanently shifted buyer priorities toward larger lots and dedicated office spaces, making the Durham Region a primary beneficiary of migration out of the downtown core.
Local employment data supports this heat. With the expansion of the Durham North healthcare corridor and tech satellite offices, the region isn’t just a bedroom community anymore. We track these migration patterns to confirm that the demand is coming from end-users who intend to live in these homes for 10 or more years, which is a key indicator of a stable, albeit hot, market.
Risk Mitigation in High-Heat Scenarios
When the market moves fast, the risks move faster. One of the most common hurdles in 2026 is the “Appraisal Gap.” This occurs when a buyer wins a bidding war at C$1.2 million, but the bank’s appraiser values the property at C$1.15 million. Because lenders only provide financing based on the lower of the two numbers, the buyer must cover that C$50,000 difference in cash. We help you prepare for these scenarios before you ever sign an offer.
- Debt-to-Income Ratios: The 2026 mortgage stress tests remain stringent; ensure your total debt service (TDS) ratio stays below 42% to maintain a safety net.
- Contingency Planning: Always include a financial condition unless you have a verified cash backup for potential appraisal shortfalls.
- Market Timing: Buying at a peak is only risky if you’re forced to sell during a dip.
Maintaining a liquid cash reserve of at least 5% to 10% of the purchase price ensures you can weather short-term valuation fluctuations without jeopardizing your primary residence. Using The Noble Approach, we analyze your full financial picture to ensure your real estate goals align with your long-term wealth strategy.
Ready to make a move with confidence? Connect with us today for a financial-first look at your next home purchase.
Navigating the Heat: Strategic Advice for Buyers and Sellers
Recognizing the signs of a hot real estate market is only the first step in a successful transaction. In a fast-paced environment where inventory might sit at less than two months of supply, as seen in many Canadian urban centres, your strategy must be disciplined and data-driven. Success isn’t just about moving quickly; it’s about moving with precision to ensure your financial goals remain intact while the market fluctuates.
The Seller’s Strategy in a Hot Market
When demand outstrips supply, it’s tempting to assume a home will sell itself. However, high-impact presentation remains a critical driver of the final sale price. Statistics from the Real Estate Staging Association suggest that staged homes can sell for 5% to 20% more than non-staged properties, even in peak markets. Professional staging creates an emotional connection that justifies a premium bid.
Pricing strategy is equally vital. Over-pricing your home can lead to “listing fatigue” where the property sits for more than 21 days, causing buyers to wonder what’s wrong with it. The Noble Approach focuses on finding the “sweet spot” that generates multiple offers without leaving money on the table. When evaluating those bids, remember that the highest price isn’t always the best. A slightly lower offer with no financing conditions and a C$50,000 deposit is often safer than a high-priced offer that could fall through. To ensure you have the right guidance during these negotiations, Finding the Right Fit is essential when selecting an agent who understands these nuances.
The Buyer’s Playbook for Winning
Buyers in 2026 face significant competition, but winning doesn’t require over-leveraging your future. Success starts with a “Clean Offer.” This means having your mortgage pre-approval finalized and your down payment liquid. In a bidding war, a seller will almost always choose the offer with the fewest hurdles. If you’re competing against five other families, a “Dear Seller” letter can sometimes help by humanizing your bid, but it’s often a waste of time if the price gap is too wide. Focus your energy on the terms instead.
- Manage your expectations: You might need to tour 10 homes and lose three bidding wars before you win one. This is a normal part of the current cycle.
- Budget for the “Gap”: If you bid C$20,000 over the asking price, ensure you have the cash to cover an appraisal gap if the bank values the home lower than your purchase price.
- Stay local: Local expertise is your ultimate differentiator. An agent who knows the specific street-level trends in Uxbridge or surrounding areas can spot value that a generalist might miss.
The goal is to make the transition into your new home stress-free and straightforward. By combining an analytical, CPA-backed perspective with a deep commitment to your experience, we ensure that even the most intense signs of a hot real estate market don’t distract from your long-term financial health. Real estate is an investment, but it’s also your life; we’re here to protect both.
Master the 2026 Market with Analytical Precision
Identifying the signs of a hot real estate market requires looking past the “Sold” signs in Uxbridge. It demands a close look at the data. In 2026, watch for inventory levels that dip below the three month mark. According to historical CREA benchmarks, this metric, combined with homes consistently selling for 5% to 10% above list price, signals a high-demand environment. These quantitative shifts mean it’s time for a strategic move based on logic rather than emotion.
Colin Noble brings the financial rigour of a CPA and CA to every transaction in the Durham Region. This analytical background ensures you aren’t just following a trend but making a sound investment. Whether you’re selling a long-term family home or entering the market for the first time, a professional who understands the numbers makes the process stress-free and straightforward. Specializing in local expertise, we help you navigate complex shifts with confidence.
Redefine your real estate expectations with The Noble Approach; contact us today. Your real estate goals are achievable with the right partner by your side.
Frequently Asked Questions
What is the number one sign of a hot real estate market?
The clearest indicator is a “Months of Inventory” (MOI) level below 3.0. In a seller’s market, homes sell faster than new listings arrive. This creates a supply crunch that pushes prices upward. Monitoring these signs of a hot real estate market helps you time your entry or exit with analytical precision.
How long does a hot real estate market usually last?
Hot markets in Ontario typically run in cycles lasting 18 to 30 months before reaching a plateau. Economic shifts or Bank of Canada policy changes usually trigger these transitions. While the pace feels frantic, these periods are finite windows of opportunity for strategic sellers to maximize their returns.
Is it better to buy or sell first in a hot market?
Buying first is often the safer strategy in a high demand environment to ensure you aren’t left without a home. It requires a firm grasp of your finances and perhaps bridge financing. The Noble Approach focuses on securing your next chapter before letting go of your current asset to keep the process stress-free.
What happens if I buy a home and the market cools down immediately?
You might see a temporary dip in paper value, but real estate remains a long-term investment. Most Canadian homeowners hold their properties for 7 to 10 years. Over a decade, historical data from the Toronto Regional Real Estate Board shows that values consistently trend upward despite short-term fluctuations.
How do interest rates affect a hot market in 2026?
Interest rates act as the primary lever for buyer demand. If the Bank of Canada maintains rates near 3.5% or 4% in 2026, it keeps monthly payments predictable for families. Lower rates typically accelerate the signs of a hot real estate market by increasing the total number of qualified buyers competing for limited stock.
Can a market be hot for sellers but still affordable for buyers?
It’s difficult to find both simultaneously because high demand naturally increases costs. However, some buyers find value in emerging pockets where price growth is just starting. Analyzing price-per-square-foot data helps identify these opportunities before they become mainstream and prices peak.
What is a “balanced market” compared to a hot one?
A balanced market occurs when the supply of homes meets demand, typically represented by 4 to 6 months of inventory. In this scenario, price growth aligns closely with the 2% annual inflation target. Buyers have more room to include conditions like home inspections or financing without losing the deal.
How can I tell if my specific neighbourhood in Uxbridge is hot?
Look for a “Days on Market” average of 14 days or less in your specific Uxbridge pocket. If 80% of homes in your neighbourhood sell at or above the asking price, you’re in a high-demand zone. I use these micro-data points to help clients redefine their expectations and make informed moves.