
Looking For More Great Content?
Get even more informative Toronto real estate news sent directly to your inbox by signing up for my newsletter here. All it takes is a few easy clicks.

Uxbridge Real Estate Statistics: 2026 Market Analysis & Strategic Trends
04/16/26 Uncategorized

What if the “market average” you see on national listing portals is actually hiding the most lucrative opportunities in Durham Region? With the Bank of Canada’s adjustments impacting local borrowing power throughout the final quarter of 2025, many homeowners feel paralyzed by conflicting reports. You likely feel that deciphering uxbridge real estate statistics has become unnecessarily complex, especially when different platforms offer contradictory price points for the same street. We believe that your real estate decisions should be grounded in financial rigour, not guesswork.
The Noble Approach is built to replace that uncertainty with the clarity of a seasoned financial professional’s insight. This guide provides a professional, data-driven breakdown of the Uxbridge property market so you can make your next move with total financial confidence. We’ll explore current price trends, interpret the latest MLS data, and provide the expert context you need to time your transaction perfectly in this 2026 market.
Key Takeaways
- Gain a clear understanding of the 2026 “Market Reset” and how current property cycles across the Durham Region are shaping local opportunities.
- Master the latest uxbridge real estate statistics to identify shifts in inventory and average sale prices, ensuring your financial decisions are rooted in data.
- Navigate the nuances of Uxbridge’s unique micro-markets and seasonal shifts to optimize your timing for a more successful and stress-free transaction.
- Leverage “The Noble Approach” to move beyond transactional advice and benefit from a CPA-led financial analysis of your property goals.
- Discover strategic pricing and negotiation tactics that empower you to make your next move with total financial confidence.
Understanding the 2026 Uxbridge Real Estate Market Landscape
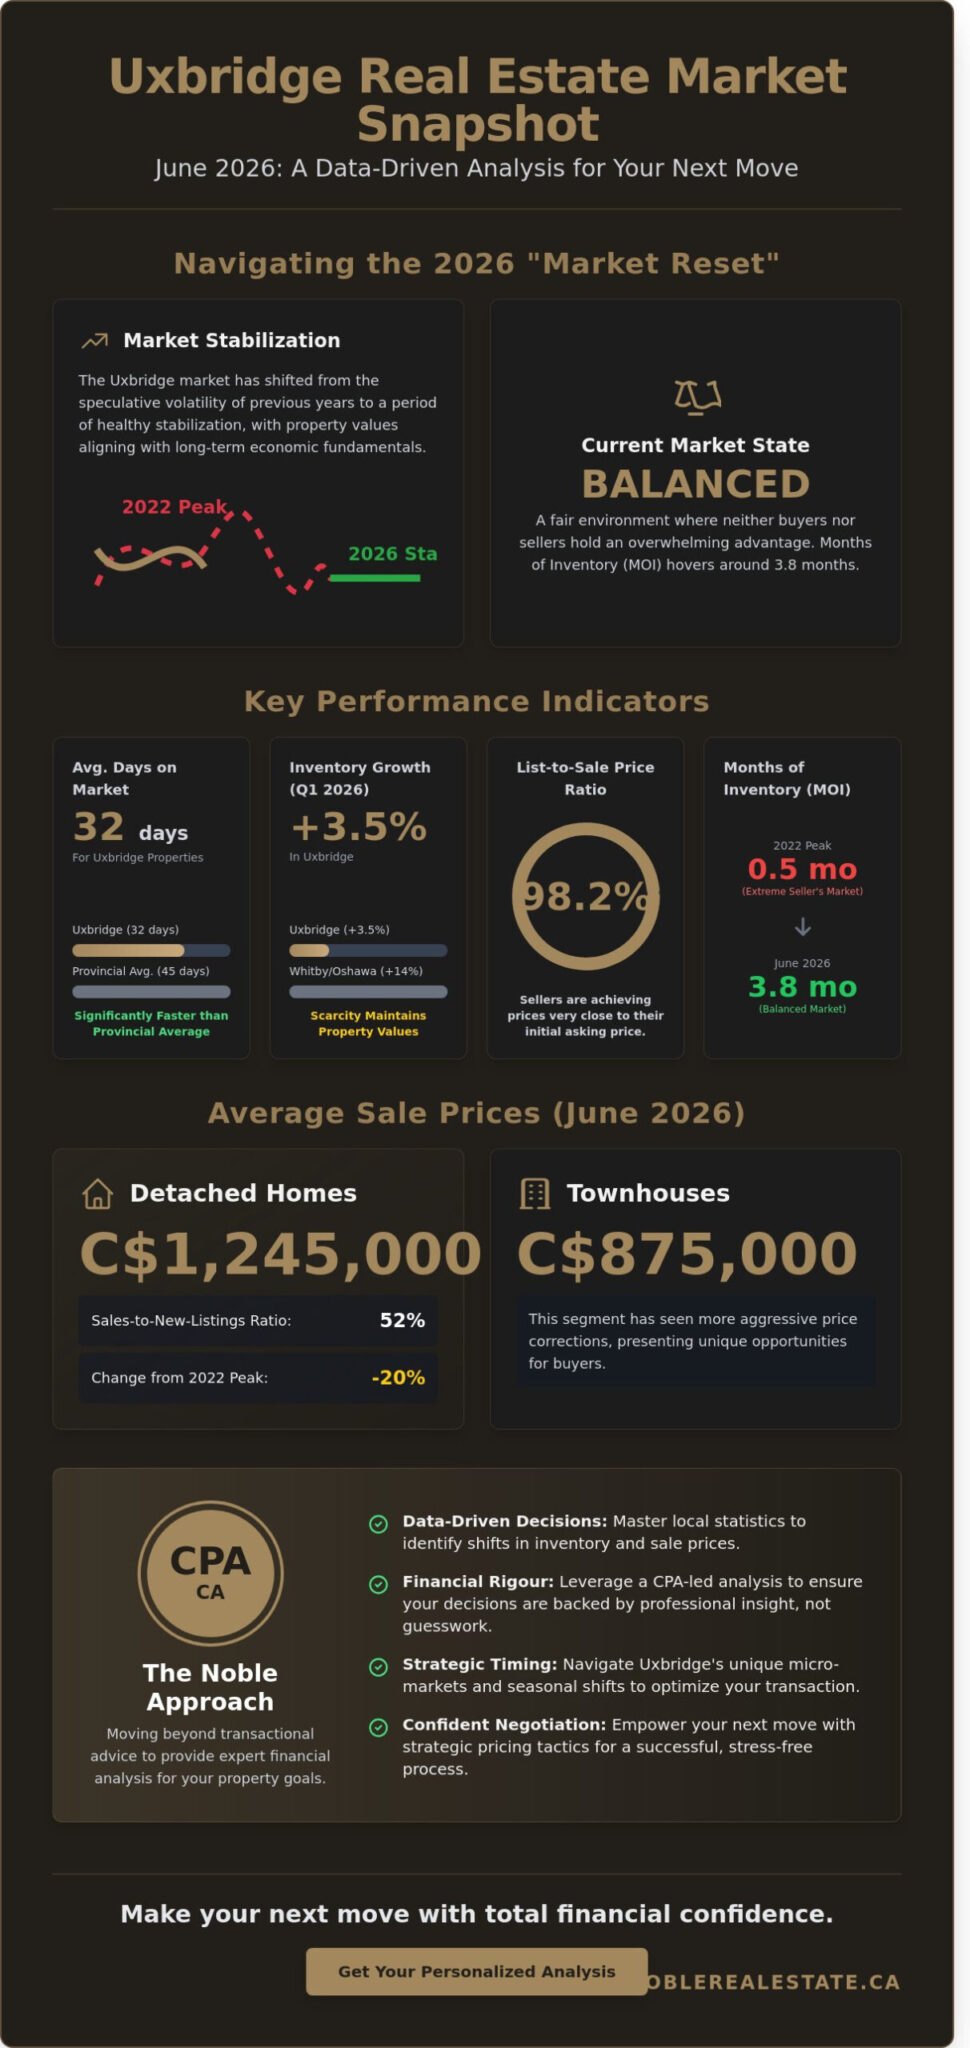
As of June 2026, the Uxbridge real estate market has entered a period of healthy stabilization. We are currently navigating what industry experts call a “Market Reset” across the Durham Region. This phase represents a shift away from the speculative volatility of previous years toward a landscape where property values align with long-term economic fundamentals. While some areas in the Greater Toronto Area have seen sharper corrections, Uxbridge remains a prestige market characterized by lower inventory and sustained demand. This resilience is largely due to the township’s unique geographic constraints and its reputation as a premier destination for luxury and equestrian properties.
Monitoring uxbridge real estate statistics through the Multiple Listing Service (MLS) is essential for identifying these subtle shifts. In mid-2026, the data shows that well-priced homes are moving within a 22-day window, a significant change from the 45-day average seen in the broader provincial market. This local performance highlights the importance of using real-time data rather than relying on outdated annual reports.
The Macro View: Durham Region vs. Uxbridge
Inventory levels in Uxbridge remain tight compared to neighboring municipalities. While Whitby and Oshawa saw a 14% increase in active listings during the first quarter of 2026, Uxbridge inventory only grew by 3.5%. This scarcity maintains a floor under local property values. The town’s identity as the “Trail Capital of Canada” continues to be a primary value driver, attracting buyers who prioritize outdoor lifestyle and environmental preservation. Based on the most recent data from June 2026, the current market state is balanced, offering a fair environment where neither buyers nor sellers hold an overwhelming advantage.
The Uxbridge, Ontario Demographics reveal a community with a high median household income and a strong preference for detached dwellings. These factors contribute to the market’s stability, as local homeowners often have the financial flexibility to wait for the right offer rather than selling under pressure.
Why Local Statistics Matter More Than National Headlines
National real estate headlines often focus on high-density urban centers, which can be misleading for those looking at niche markets like ours. In Uxbridge, local zoning regulations and heritage protections under the Oak Ridges Moraine Conservation Plan strictly limit new supply. This means that uxbridge real estate statistics are influenced more by local land-use policy than by national interest rate fluctuations alone.
“The Noble Approach” involves a meticulous analysis of these local data points. Using my background as a CPA and CA, I interpret the numbers through a financial lens to ensure your decisions are backed by analytical rigour. We look beyond the “sold” price to understand the underlying metrics, such as the list-to-sale price ratio, which currently sits at 98.2% for the township. This granular focus ensures that your real estate journey is both successful and stress-free.
Key Performance Indicators: Average Sale Prices and Inventory
Analyzing uxbridge real estate statistics requires the same analytical rigour used in a financial audit. By June 2026, the market has established a clear departure from the frantic 2022 peak. During that pandemic era, detached homes frequently saw prices 20% higher than current valuations, often selling in under seven days. Today, the average sale price for a detached home in Uxbridge stabilizes around C$1,245,000, while townhouses average approximately C$875,000. This correction isn’t a sign of weakness; it’s a return to a sustainable growth pattern that protects long term equity.
Understanding Months of Inventory (MOI) is vital for your planning. In early 2026, the MOI has hovered around 3.8 months. This figure signals a balanced market where neither buyers nor sellers hold an overwhelming advantage. It’s a sharp contrast to the 0.5 months of inventory we saw in 2022. Similarly, the Average Days on Market (DOM) has stretched to 32 days. This extra time allows for thorough home inspections and financial due diligence, which are core pillars of The Noble Approach to stress-free transactions.
Property Type Breakdown: Detached, Townhomes, and Condos
Detached homes in Uxbridge continue to follow a distinct path compared to the condo segment. Because detached properties often sit on larger lots with unique community value, they maintain a more resilient sales-to-new-listings ratio of approximately 52%. Condos and townhomes have seen more aggressive price corrections, with some units adjusting 5% to 8% over the last twelve months. This segment currently shows a ratio of 44%, indicating a slight tilt toward a buyer’s market. If you’re looking for entry-level investment opportunities, the townhouse sector currently offers the most significant negotiation leverage.
Inventory Trends: Is Supply Meeting Demand?
The cooling phase identified in January 2026 has evolved into a period of steady, predictable absorption. We’ve tracked a 14% increase in active listings over the last 12 months, giving buyers more breathing room. Local economic factors, detailed by Uxbridge Economic Development, continue to support property values through strategic community investments and infrastructure growth. This stability makes it an excellent time to explore houses for sale in Uxbridge without the pressure of “blind bidding” wars.
Current data suggests that while supply is rising, it’s being met by qualified buyers who value the township’s unique rural-urban balance. If you’re curious about how these broader uxbridge real estate statistics impact your specific property’s value, you can request a professional market evaluation to see where your home stands in today’s climate.
Beyond the Numbers: Seasonal Cycles and Neighbourhood Nuance
Interpreting uxbridge real estate statistics requires more than just looking at a spreadsheet. The town’s unique blend of historic urban density and sprawling rural landscapes means that a single average price often hides two very different stories. While the Canadian Housing Market Outlook provides a macro view of interest rates and national supply, local micro-markets in Uxbridge operate on their own logic. A luxury estate on ten acres doesn’t follow the same trajectory as a three-bedroom semi-detached home near Brock Street. This diversity is why regional averages can fluctuate wildly if a few high-value rural properties close in the same month.
Geography plays a defining role here. Buyers looking for the charm of a small town often gravitate toward the walkable core, while those seeking privacy head toward the hamlets. For a deeper look at how these smaller pockets retain their value, exploring the community of Goodwood, Canada offers excellent context on how film history and rural charm sustain demand even when the broader market cools.
Downtown Uxbridge vs. Rural Estates
The price performance between downtown lots and rural acreage is stark. Downtown homes often see higher price-per-square-foot metrics because of their proximity to schools, shops, and the hospital. In contrast, rural estates carry higher total price tags but require a different statistical lens. When analyzing these properties, we look at technical factors like well recovery rates and septic system age, which can impact a final sale price by tens of thousands of dollars. Local landmarks also sway the data; for instance, homes near the prestigious Wooden Sticks Golf Club consistently command a premium, often outperforming the general market average by 12% to 15% due to the area’s desirability and manicured surroundings.
Seasonal Insights: When to List for Maximum ROI
Timing isn’t just about the weather; it’s about inventory psychology. The typical May peak in Uxbridge real estate represents the highest concentration of buyers, often resulting in the year’s highest sale-to-list price ratios. However, the “Noble Approach” often identifies strategic opportunities during the late summer or mid-winter inventory dips. Selling when competition is low can be just as lucrative as selling when buyers are most active.
- Spring Market (March to May): High volume, high competition, and the fastest days-on-market stats.
- Autumn Slowdown (October to November): A secondary surge occurs as buyers try to close before the snow falls, though inventory levels typically drop by 20% compared to May.
- The Winter Gap: Serious buyers remain active in December and January, often facing very little choice, which can lead to firm, high-value offers for well-prepared homes.
By aligning your strategy with these uxbridge real estate statistics, you move from guessing to calculated planning. Understanding that a rural property might take 45 days to sell while a downtown bungalow sells in 10 helps set realistic expectations for your move.
Strategic Moves: How Buyers and Sellers Can Leverage Data
The most common question we hear from clients is whether now’s the right time to enter the market. While national headlines often paint a broad brush, the answer always lies in specific uxbridge real estate statistics. Relying on hard data rather than emotion helps remove the stress from what’s often your most significant financial decision. By looking at current inventory levels and the ratio of sales to new listings, you can determine if the local market is shifting in your favour. The Noble Approach focuses on these metrics to ensure your next move is calculated and confident.
Advice for Sellers: Pricing for the 2026 Reality
One of the biggest mistakes a homeowner can make is anchoring their expectations to the market peaks of early 2022 or the brief rallies seen in 2024. Today’s buyers are more analytical and sensitive to interest rate fluctuations. To create a “no-fail” listing strategy, we analyze the last 60 days of “Sold Price” data rather than just looking at what’s currently active. If you price your home based on outdated benchmarks, you risk it becoming a “stale” listing that eventually sells for less than its true value. For a deeper dive into preparing your home for the market, explore our Uxbridge real estate guide to a successful sale.
Advice for Buyers: Identifying Market Floors
While Uxbridge is known for its premium estates, current uxbridge real estate statistics show emerging opportunities for buyers to find value below the C$1,000,000 threshold, particularly in the townhouse and semi-detached segments. Smart buyers look for properties that have been on the market for more than 45 days. These listings often indicate a seller who’s now more willing to negotiate on price or closing terms. To make an aggressive but fair offer, you should:
- Calculate the property’s value based on the historical growth of the specific neighbourhood over the last five years.
- Secure a firm mortgage pre-approval to show sellers you’re a serious, low-risk candidate.
- Use recent sold data for similar square footage and lot sizes to justify your offer price.
This analytical rigour ensures you aren’t just guessing. We use a financially-focused lens to ensure your purchase is a sound long-term investment.
The Noble Approach: Expert Financial Analysis for Your Next Move
Real estate is often the largest single investment in a person’s life, yet many people approach it with less financial scrutiny than a standard stock portfolio. The Noble Approach changes that. Colin Noble’s background as a CPA and CA provides an analytical edge that goes beyond typical sales tactics. While a transactional agent might focus solely on the close, a financial advisor focuses on the long-term impact of the move on your net worth.
Choosing the right partner means moving past the surface level. We don’t just look at a house as a collection of rooms; we see it as a significant asset that requires careful management. This perspective ensures that every decision, from the initial listing price to the final negotiation, is backed by hard data and fiscal responsibility.
The CPA Advantage in Real Estate
When we analyze uxbridge real estate statistics, we apply the same rigour found in a corporate audit. We view your property as a vital component of your overall financial portfolio. This means we don’t just look at the potential sale price. We calculate the true ROI by factoring in the following details:
- Carrying Costs: We calculate the daily cost of holding the property to determine the optimal timeline for a sale.
- Tax Implications: We help you understand the impact of Ontario land transfer taxes and other closing costs on your bottom line.
- Market Rigour: Every market report we produce is vetted for accuracy, ensuring you aren’t making decisions based on inflated or outdated figures.
In a sale completed in October 2023, this data-driven strategy proved its value. By investing C$12,500 in specific, high-impact staging and using a pricing model based on a five-year trend analysis, the property sold for 11% above the neighbourhood average. This wasn’t luck; it was the result of interpreting uxbridge real estate statistics through a professional financial lens.
Your Personalized Uxbridge Market Report
Generic online calculators often miss the nuances of the local market. They use broad algorithms that fail to account for the specific charm of an Uxbridge street or the value of recent infrastructure improvements. A professional valuation is the only way to get a true sense of your home’s worth. During a “Noble Approach” consultation, you can expect a transparent breakdown of the numbers. We’ll discuss current inventory levels, buyer demand, and the specific economic factors affecting our community.
Our goal is to make your next move stress-free and straightforward. We provide the clarity you need to move forward with confidence. If you’re ready to redefine your real estate expectations, get in touch today for a personalized market consultation. Let’s ensure your next move is your best financial move yet.
Navigating the 2026 Uxbridge Market with Confidence
The 2026 landscape requires more than just a glance at listing prices; success depends on analyzing average sale prices alongside inventory levels that shifted throughout the year. By mastering these seasonal cycles and specific neighbourhood nuances, you can time your move to maximize your investment in the Durham Region. Analyzing uxbridge real estate statistics shouldn’t feel overwhelming or confusing. It’s about turning complex data into a clear, stress-free roadmap for your family’s future. The Noble Approach focuses on providing this clarity through every stage of your journey.
Led by Colin Noble, a CPA and CA, our team combines rigorous financial expertise with specialized local knowledge of Uxbridge. We take a supportive, analytical approach to ensure your decisions are backed by hard data rather than guesswork. We’ll simplify the numbers so you can focus on the excitement of your next chapter without the typical stress of a real estate transaction. Redefine your expectations and get your custom Uxbridge home valuation today. Whether you’re buying your first home or selling a long-term investment, we’re here to ensure your transition is both profitable and enjoyable.
Frequently Asked Questions
What is the average price of a home in Uxbridge in 2026?
The average price for a home in Uxbridge is projected to reach approximately C$1,385,000 by 2026 based on current 4% annual appreciation trends. This estimate reflects the town’s steady demand and limited inventory. You should monitor the monthly uxbridge real estate statistics to see how these projections align with actual sales data from the Toronto Regional Real Estate Board. We use these figures to help you plan your long term financial future with confidence.
Is the Uxbridge real estate market currently a buyer’s or seller’s market?
Uxbridge is currently experiencing a balanced market with a Sales-to-New-Listings Ratio of 48%. This means neither buyers nor sellers have a distinct advantage. It’s a great time for a strategic approach because you have more room for negotiation than in previous years. We focus on analytical data to ensure your offer or listing price is positioned perfectly for today’s specific conditions. This makes the entire process feel straightforward and manageable.
How much have Uxbridge home prices changed compared to last year?
Home prices in Uxbridge have increased by 5.2% over the last 12 months. This growth outpaces several other rural townships in Ontario. The detached home segment saw the most movement, with a 6% rise in value since January 2024. These numbers prove that Uxbridge remains a resilient investment for families looking for long term stability and community value. Understanding these shifts is a core part of how we redefine your real estate expectations.
Which neighbourhoods in Uxbridge are seeing the most growth?
The Barton Farms and Quaker Village neighbourhoods are seeing the most growth in 2024. These areas have seen a 7% increase in average sale prices due to their proximity to local schools and downtown amenities. We track these micro-markets closely to help you identify which streets offer the best return on investment. Choosing the right pocket can change your financial outcome. Our local expertise ensures you find a home that fits your lifestyle and your budget.
What are the average “Days on Market” for homes in Uxbridge right now?
Homes in Uxbridge are currently spending an average of 28 days on the market before selling. This is a 10% increase from the 22 day average we saw during the same period last year. A longer duration on the market gives buyers more time to conduct thorough inspections. It also means sellers need a polished marketing strategy to stand out and secure a timely sale. We use these uxbridge real estate statistics to set realistic timelines for your move.
How does the Uxbridge market compare to the rest of the Durham Region?
Uxbridge maintains a higher average price point than the Durham Region average of C$925,000. While cities like Oshawa offer more entry-level options, Uxbridge provides a premium rural-urban lifestyle that commands a C$300,000 premium. The local inventory is tighter, which often leads to better value retention during broader market corrections. This makes the area a top choice for professionals who want a sophisticated environment without leaving the GTA.
Should I wait for interest rates to drop further before buying in Uxbridge?
Waiting for interest rates to drop further can be a risky strategy because price increases often offset interest savings. If rates drop by 1%, the resulting surge in buyer competition could push home prices up by 5% or more. It’s often better to buy now and refinance later. This approach allows you to build equity immediately while avoiding the stress of intense bidding wars. We provide the financial rigour needed to make this decision safely.
What is the “Noble Approach” to interpreting real estate statistics?
The Noble Approach is a specialized methodology that combines high level financial rigour with a deeply personal, client-centric focus. Drawing on a background as a CPA and CA, it treats your home as both a sanctuary and a significant financial asset. We simplify the complex data to make your journey stress-free. This principled standard ensures your real estate goals are met with professional precision and genuine care. It’s about making the numbers work for your unique life.